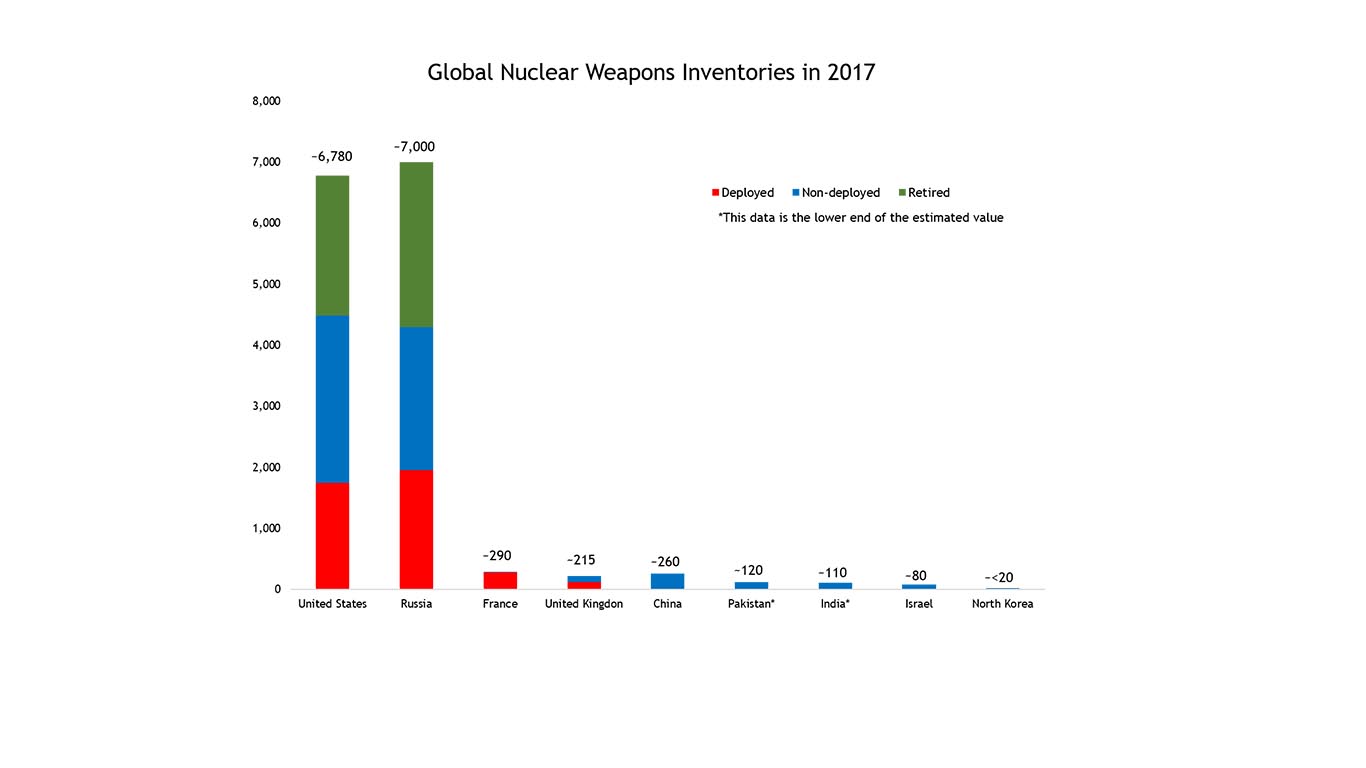
Unless otherwise specified, all information in this chart comes from Kristensen’s and Norris’s Status of World Nuclear Forces 2017
|
CHART: Global Nuclear Weapons Inventories 2017 |
||||
| Deployed | Non-deployed | Retired | Total | |
| United States[i] | ~1,740a | ~2,260 | ~2,800 | ~6,800 |
| Russia[ii] | ~1,950a | ~2,350 | ~2,700 | ~7,000 |
| France | ~280 | ~10 | * | ~290 |
| United Kingdom | ~120 | ~95 | * | ~215 |
| China | 0 | ~260 | * | ~260 |
| Pakistan | 0 | ~120-130 | * | ~120-130 |
| India | 0 | ~110-120 | * | ~110-120 |
| Israel | 0 | ~80 | * | ~80 |
| North Korea[iii] | 0 | <20 | * | <20 |
| Total | ~4,090 | ~5,785b | ~5,000 | ~14,875b |
[i] Kristensen and Norris, US Nuclear Forces, 2017
[ii] Kristensen and Norris, Russian Nuclear Forces, 2017
a Higher than New START aggregate because it does not follow the New START bomber counting rule.
b Calculated using the lower-end estimate of ranges
* Information unavailable

