By Sarah Tully
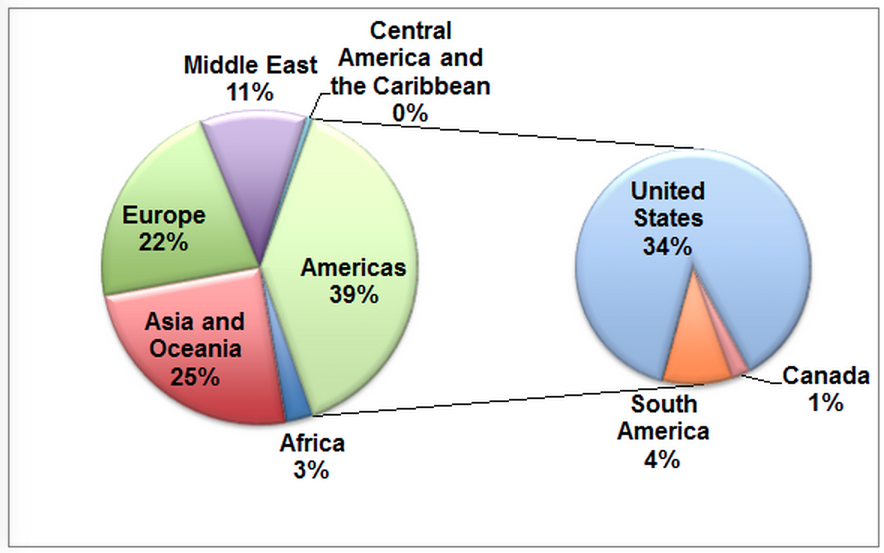
According to the SIPRI Military Expenditure Database 2015, in 2014, the U.S. approved $609.9 billion in defense budget authority (fiscal year 2014 dollars). This figure includes funding for the Pentagon base budget, money allocated for the Pentagon in the Overseas Contingency Operations fund, and defense related activities in the 050 budget function. It also includes Department of Energy-administered atomic energy defense activities.
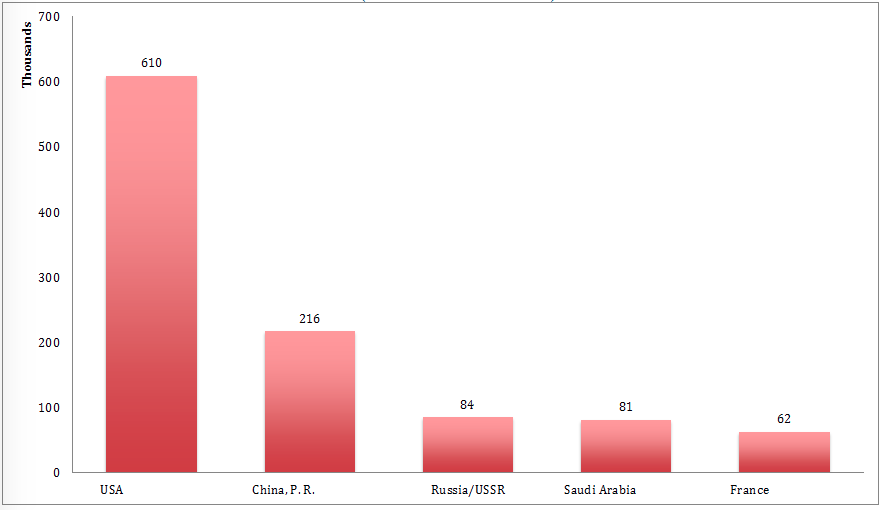
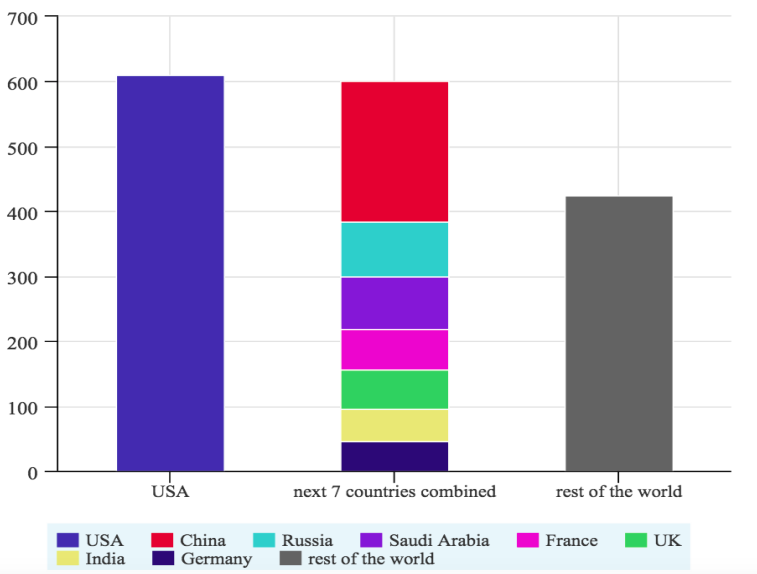
This number accounts for 34 percent of total global military spending and puts the U.S. far above any potential adversary. The next closest country, China, comes in at $216.4 billion, or 12 percent of total global military spending. That means the U.S. spends nearly three times as much on defense than China, and more than seven times what Russia spends. Last year, the U.S. spent more on defense than the next seven countries combined, five of which are allies.
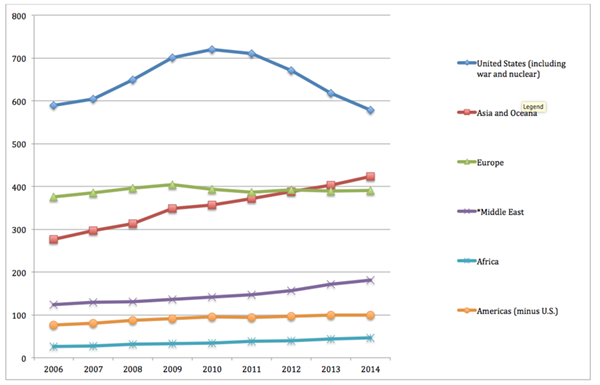
While U.S. spending is down since peak expenditure in 2010, the total defense spending for 2014 was only $11 billion less than in 2006, when we were fully engaged in two wars overseas.
Global Total: $1.78 Trillion
Top Five Spenders on Defense (in billions of current U.S. dollars)
U.S. vs. Global Military Spending (in billions of current U.S. dollars)
2006-2014 Defense Expenditure (in billions of constant 2011 U.S. dollars)
| Country or Region | 2006 Spending | 2007 Spending | 2008 Spending | 2009 Spending | 2010 Spending | 2011 Spending | 2012 Spending | 2013 Spending | 2014 Spending |
| United States (including war and nuclear) | 589 | 604 | 649 | 701 | 720 | 711 | 671 | 618 | 587 |
| Asia and Oceana | 276 | 297 | 313 | 349 | 356 | 371 | 388 | 403 | 423 |
| *Middle East | 123 | 130 | 131 | 137 | 142 | 147 | 156 | 172 | 181 |
| Africa | 26.2 | 27.2 | 31.0 | 32.5 | 34.6 | 38.9 | 40.4 | 43.9 | 46.5 |
| America (minus U.S.) | 76 | 81 | 88 | 92 | 95 | 94 | 97 | 100 | 99 |
| Global Total | 1464 | 1522 | 1604 | 1712 | 1738 | 1744 | 1740 | 1719 | 1711 |
Figures in red indicate that more than 10% of the total figure consists of estimates for countries for which data is missing.
*Middle East total from SIPRI data release (which is slightly higher than the time-consistent 1988-2014 series.)
2010-2014 Defense Expenditure (in billions of constant U.S. dollars)
Countries of Interest (in billions of current U.S. dollars)
| Country | 2014 Spending |
| Afghanistan | 0.27 |
| Australia | 25.4 |
| Brazil | 31.7 |
| Canada | 17.5 |
| China | 216.4 |
| France | 62.3 |
| Germany | 46.5 |
| India | 50 |
| Iran | ** |
| Iraq | 9.5 |
| Israel | 15.9 |
| Italy | 30.9 |
| Japan | 45.8 |
| Jordan | 1.3 |
| Libya | 3.3 |
| North Korea | 0.83 |
| Oman | 9.6 |
| Pakistan | 8.5 |
| Russia | 84.54 |
| Saudia Arabia | 80.8 |
| South Korea | 36.7 |
| Taiwan | 10.2 |
| UAE | 22.8 |
| United Kingdom | 60.5 |
| United States* | 609.9 |
| Venezuela | 5.6 |
| Yemen | 1.7 |