• Skip to main content
  • Skip to primary sidebar
  • Skip to footer

Center for Arms Control and Non-Proliferation

Center for Arms Control and Non-Proliferation

  • Policy Issues
    • Fact Sheets
    • Countries
    • Nuclear Weapons
    • Non-Proliferation
    • Nuclear Security
    • Biological & Chemical Weapons
    • Defense Spending
    • Missile Defense
    • No First Use
  • Nukes of Hazard
    • Podcast
    • Blog
      • Next Up In Arms Control
    • Videos
  • Join Us
  • Press
  • About
    • Staff
    • Boards & Experts
    • Jobs & Internships
    • Financials and Annual Reports
    • Contact Us
  • Donate
  • Search
You are here: Home / Archives for Security Spending / Nuclear Weapons Spending / Infographics on Nuclear Weapons Spending

Infographics on Nuclear Weapons Spending

February 23, 2021

3 Reasons Why the United States Doesn’t Need ICBMs

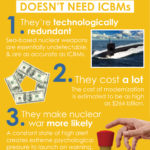
As a part of the $1.5 trillion nuclear modernization plan, the Air Force plans to replace the land-based leg of the nuclear triad with a completely new ICBM, the Ground Based Strategic Deterrent. But do we actually need these ground-based missiles?

Posted in: Infographics on Nuclear Weapons, Infographics on Nuclear Weapons Spending, Infographics on Pentagon Budget, United States

February 23, 2021

Modernizing the Triad

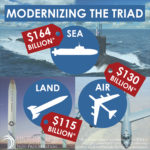
The United States is projected to spend $1.5 trillion (before inflation) to overhaul its nuclear arsenal by rebuilding each leg of the nuclear triad and its accompanying infrastructure. Here’s a breakdown of the costs of some of the biggest line items.

Posted in: Infographics on Nuclear Weapons, Infographics on Nuclear Weapons Spending, Infographics on Pentagon Budget, United States

December 10, 2020

How is the National Defense Authorization Act passed?

Posted in: Infographics on Nuclear Weapons Spending, Infographics on Pentagon Budget, Nuclear Weapons Spending, Nukes of Hazard blog, Pentagon Budget, Security Spending, United States

November 8, 2016

Cost of U.S. Nuclear Triad Modernization: $1 Trillion

Click here for a printable PDF version.

Posted in: Infographics on Nuclear Weapons, Infographics on Nuclear Weapons Spending, Nuclear Weapons, Nuclear Weapons Spending, United States

October 11, 2016

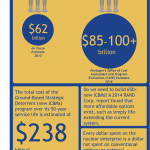
New ICBMs cost estimates

Click here for a printable PDF version.

Posted in: Infographics on Nuclear Weapons Spending, Nuclear Weapons Spending

  • Page 1
  • Page 2
  • Go to Next Page »

Primary Sidebar

Recent Posts

  • Does the Trump administration understand how ‘enriched’ uranium is made into weapons? April 1, 2026
  • Will the Iran war set off a new nuclear arms race? “No one speaks of taking out Kim Jong Un” March 25, 2026
  • Front and Center: March 22, 2026 March 22, 2026
  • Why Did the United States Lift Sanctions on Assad’s Chemical Weapons Scientists? March 20, 2026
  • Iran’s Stockpile of Highly Enriched Uranium: Worth Bargaining For? March 16, 2026

Footer

Center for Arms Control and Non-Proliferation

820 1st Street NE, Suite LL-180
Washington, D.C. 20002
Phone: 202.546.0795

Issues

  • Fact Sheets
  • Countries
  • Nuclear Weapons
  • Non-Proliferation
  • Nuclear Security
  • Defense Spending
  • Biological and Chemical Weapons
  • Missile Defense
  • No First Use

Countries

  • China
  • France
  • India and Pakistan
  • Iran
  • Israel
  • North Korea
  • Russia
  • United Kingdom

Explore

  • Nukes of Hazard blog
  • Nukes of Hazard podcast
  • Nukes of Hazard videos
  • Front and Center
  • Fact Sheets

About

  • About
  • Meet the Staff
  • Boards & Experts
  • Press
  • Jobs & Internships
  • Financials and Annual Reports
  • Contact Us
  • Council for a Livable World
  • Twitter
  • YouTube
  • Instagram
  • Facebook

© 2026 Center for Arms Control and Non-Proliferation
Privacy Policy

Charity Navigator GuideStar Seal of Transparency